Klad: a canvas-based tree engine for large trees
Klad is a tree engine I wrote for the web. It lays out and draws the tree on a canvas inside a Web Worker, and mounts framework components only for the nodes that are on screen and zoomed in far enough to read.
DOM-based org chart libraries slow down on large trees, because each node is an element and each connector is another one. A five hundred person chart leaves the browser with several thousand elements to lay out and style, and most of them sit off screen at any given moment.
Lists solve this with virtualisation, which works because a list is one-dimensional: draw the rows on screen and skip the rest. A tree is messier, since nodes sit on a two-dimensional plane with connectors running between them. What Klad does is move that two-dimensional scene onto a canvas and use the DOM only where something is actually being read.
Basic usage
data is a flat array, and the only option without a default.
import { createKlad } from '@klad/core'

const chart = createKlad(document.getElementById('chart')!, {
  data: [
    { id: 'ceo', name: 'Jamie Fox', title: 'CEO' },
    { id: 'cto', parentId: 'ceo', name: 'Amy Chen', title: 'CTO' },
    { id: 'cfo', parentId: 'ceo', name: 'Priya Rao', title: 'CFO' },
  ],
})

chart.on('nodeClick', ({ id, item }) => console.log('clicked', id, item))
Each item is { id, parentId?, ...your own fields }, so you never have to build a nested children structure. If a parentId matches no record, that node is treated as a root and a warning event is emitted instead of an exception. Data usually comes from a database that makes no promises about referential integrity, so I left it that way on purpose.
nodeSize
Layout runs inside a worker, which leaves it without a DOM to measure. You declare node sizes yourself:
nodeSize: Size | ((item: NodeData) => Size) // Size = { w: number; h: number }
When a card's height does change, api.refresh() re-reads every size and lays out again. Expand/collapse state, camera position and highlight all survive that.
If the worker cannot start
It logs the reason with console.warn and falls back to the main thread. In practice a few things trigger it: a CSP that blocks worker scripts, a browser without OffscreenCanvas, a canvas whose 2D context has already been taken. Options, events and the API stay the same in that mode. You can take the same route deliberately with worker: false.
Where components come in
Drawing everything on a canvas would mean throwing away the design system you already have. In Klad the canvas is the cheapest tier of a level-of-detail system.
export type LodTier = 'block' | 'label' | 'full'

export const DEFAULT_LOD: LodThresholds = { text: 0.25, overlay: 0.6 }
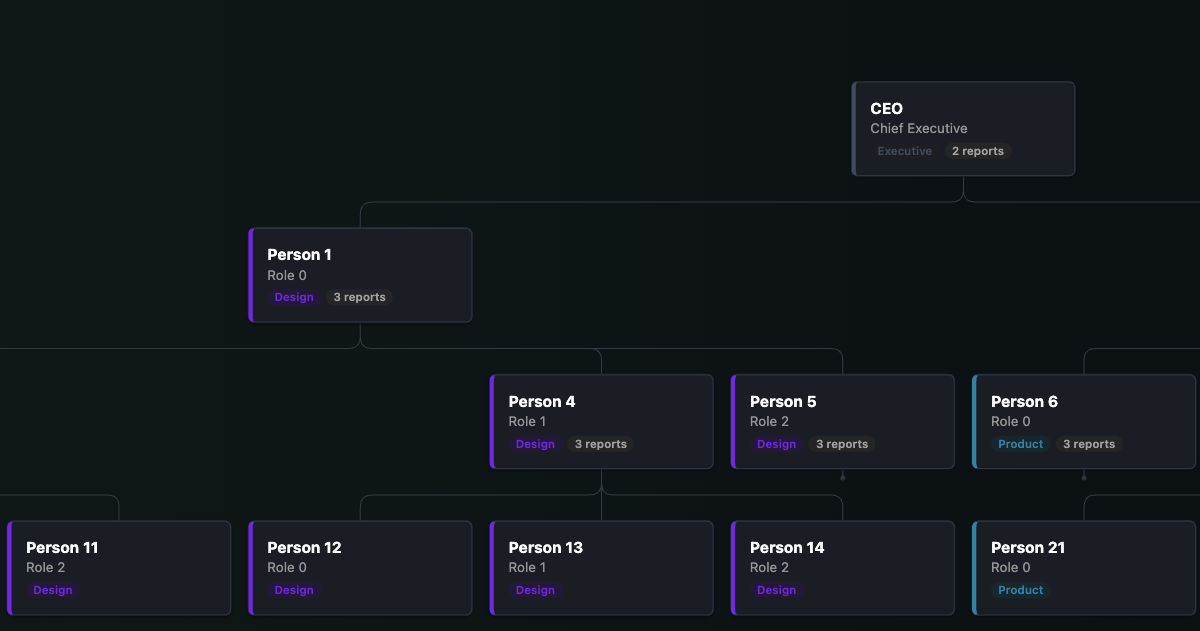
block— below 0.25 zoom, only boxes and connectors are drawn; text is not readable at that scale anyway.label— one truncated line of text per node.full— at 0.6 and above the full card is drawn and the DOM overlay activates.
A node becomes a real element only in the last tier. Your Vue slot, React render prop or your own DOM is mounted here, and those elements are pooled and reused as you move around.
flowchart LR
    Data["{ id, parentId }"] --> Worker[Web Worker: layout]
    Worker --> Canvas[Canvas draw]
    Canvas --> Zoom{"zoom >= 0.6"}
    Zoom -->|no| Done[Canvas only]
    Zoom -->|yes| Overlay[Mount components for visible nodes]
If the zoom value somehow ends up as NaN, every >= comparison returns false and the system settles on block, the cheapest tier. That is the behaviour I wanted out of a broken state.
One data shape, four layouts
An org chart and a file explorer hold the same data; what changes is how that data gets drawn. So layout is an option, and the same flat array feeds all four.
createKlad(host, { data, layout: 'sunburst' })
| Layout | For | Grows |
|---|---|---|
tidy |
Org charts, decision trees, anything read top-down. The default. | Wide, fast |
file |
File explorers, outlines, long nested lists. | Down only |
radial |
Wide, shallow trees: a root with many short branches. | Outward |
sunburst |
Proportions: how much of a level a branch takes up. | Outward, bounded |
orientation applies to tidy only: 'tb' | 'bt' | 'lr' | 'rl'. There is also rtl to reverse sibling order.
file stands apart on scale, because it is the only layout whose width does not grow with the tree. A thousand siblings turn into a thousand rows and the width stays put. For large, mostly-collapsed structures it was the only shape left that stayed usable.
Trees you cannot load up front
Most charts need the whole tree before they can draw anything, which rules out the cases where the shape helps most: a file system too large to enumerate, a taxonomy behind an API.
const chart = createKlad(host, {
  data: roots,
  mayHaveChildren: (item) => Number(item.childCount) > 0,
  loadChildren: (item) => fetch(`/api/children/${item.id}`).then((r) => r.json()),
})
There are two options here for a reason: the chart only sees the data it was given. A node with no children in data looks exactly like a real leaf to it, and neither has anything to click. Something has to say there is more before anything can be fetched.
mayHaveChildren provides that. You usually answer from a count field, and that count can be wrong. A node that turns out to have no children once loadChildren returns quietly becomes a leaf, and everything else carries on.
Very wide levels
A manager with four hundred reports, or a folder with ten thousand files, makes that level unreadable. Zooming does not rescue it either.
const chart = createKlad(host, {
  data,
  maxChildren: 8,
  pinChildren: (item) => watching.has(String(item.id)),
})
There are two options here as well. maxChildren performs a plain truncation, showing whichever nodes come first. Working through five levels of a hundred, the eight that matter to you are unlikely to be the first eight.
pinChildren decides which ones are shown: the records you are working on, a search result, the current selection. Pinned nodes come before the limit and are not counted against it, so pin ten with a limit of eight and you see ten. Ordering follows the data in either case, so a pinned node keeps its place among its siblings rather than jumping to the front.
Accessibility
A canvas is an invisible surface as far as screen readers are concerned. Drawing the chart on a canvas and stopping there produces an interface a screen reader user cannot open at all.
So a hidden but real DOM tree sits alongside the canvas. Each node has a row with role="treeitem", and aria-expanded and aria-level are kept up to date. Rows are hidden by clipping rather than display: none, because display: none would also remove them from the accessibility tree and leave no reason to keep them. They use content-visibility: auto to keep that hidden DOM cheap on large trees.
| Key | Effect |
|---|---|
↑ / ↓ |
Previous / next row |
→ |
Expands a collapsed node, or moves to the first child if already expanded |
← |
Collapses an expanded node, or moves to the parent if collapsed or a leaf |
Enter / Space |
Expands or collapses the focused row |
Home / End |
First / last row |
m |
Picks up the focused node; a second m drops it wherever focus is |
The camera pans to the focused node as focus moves, so the canvas follows the screen reader.
Editing
With dragAndDrop: true you can drag a node to another parent or between two siblings. If the node is part of a selection, the whole selection moves with it. Collapsed branches open when the pointer rests on them. Moves that would create a cycle are refused, and Escape puts the node back. The same operation is available from the keyboard with m.
Every move is emitted as an event before it happens, and you disallow one by calling preventDefault(). That way you never have to describe your business rules to the chart.
Current state
Klad is at 1.8.0 and is published as ESM only.
| Package | For |
|---|---|
@klad/core |
The framework-agnostic API. One function: createKlad. |
@klad/vue |
Vue 3: a <Klad> component with a #node scoped slot, plus useKlad(). |
@klad/react |
React: <Klad> with a render prop and a ref handle. |
@klad/engine |
Layout, viewport maths, spatial index, renderer, worker protocol. No DOM. Only needed if you are writing a new binding. |
npm install @klad/core   # framework-agnostic
npm install @klad/vue    # Vue 3 (>=3.5 <4)
npm install @klad/react  # React (>=18)
The packages build on each other, so installing one is enough. You do not need @klad/core separately for the Vue adapter.
Requirements: Worker, OffscreenCanvas, ResizeObserver and Canvas2D. All are available in current browsers.
There are 442 tests across the engine, core, vue and react packages, and a good number of them run in a real browser rather than a simulated DOM. The playground has four orientations, RTL, variable node sizes, nine card treatments and a 20,000-node stress test.
There are two licence options: AGPL v3 or later by default, and a commercial licence for anyone who needs to use it in a closed-source product or a hosted service without the AGPL's source obligation.
- Documentation, API reference and a playground where you can try the options live: klad.ozdemir.be
- Source: github.com/n1crack/klad
If you try it and run into a problem, let me know.